Smoobu statistics explained: reading occupancy, ADR and RevPAR correctly
Smoobu is a strong channel manager and property management system: one calendar, synced portals, messages and bookings in one place. But the moment you want to know whether your rental business is actually working — whether your price is right, whether your occupancy is good, whether you're ahead of last year — the built-in reporting quickly hits its limits. You can see that a booking came in. But not the three or four numbers a pricing decision is built on.
This guide shows which metrics from your Smoobu data really matter, how to calculate them (with formulas and a live calculator) — and where the most common analysis mistakes hide. Every example figure and screenshot comes from a real SmooInsight account.
One example account in numbers — SmooInsight calculates exactly these metrics automatically from your Smoobu bookings:
What Smoobu shows you — and where the analysis stops
Smoobu bundles your bookings from Airbnb, Booking.com, Vrbo and direct bookings into one calendar and shows revenue and a booking list in the dashboard. For day-to-day operations that's fine. For steering your business, the decisive comparison and performance metrics are missing:
- No ADR, no RevPAR: The average nightly rate and revenue per available night — the two metrics hotels price against — you have to work out yourself.
- Occupancy without a clean base: A percentage only helps if blocked days and true capacity are handled correctly.
- No booking pace comparison: "Am I ahead of or behind last year at today's cut-off?" is not something raw annual revenue answers.
- No forecast: Projecting the month-end result from today's position — not available.
- Net per channel: What's left after commission from Booking.com & co. isn't shown side by side anywhere.
The usual workaround is a CSV export into a spreadsheet. It works — but it costs a diligent hour every time, which is exactly why almost nobody does it weekly. Yet the value of an analysis lies precisely in the repetition.
The four metrics that decide your profit
Whether you run two apartments or twenty — four numbers are enough to understand your business. You know the first two; the last two separate gut feeling from real steering.
1. Revenue — but attributed correctly
Revenue is not just revenue. What matters is which month you attribute it to: the month of the booking or the month of the stay. For pricing decisions the stay month counts (when does the property earn?); for cash flow it's the booking date. Mix the two and you're comparing apples with oranges.
2. Occupancy — the base makes the difference
Occupancy tells you how much of your available capacity you actually sold.
available nights = number of units × days in the period
The most common mistake sits in the denominator: if you count deliberately blocked days (owner use, renovation) as "available", you artificially push your occupancy down. Calculated cleanly, only the days you genuinely wanted to rent belong in the denominator.
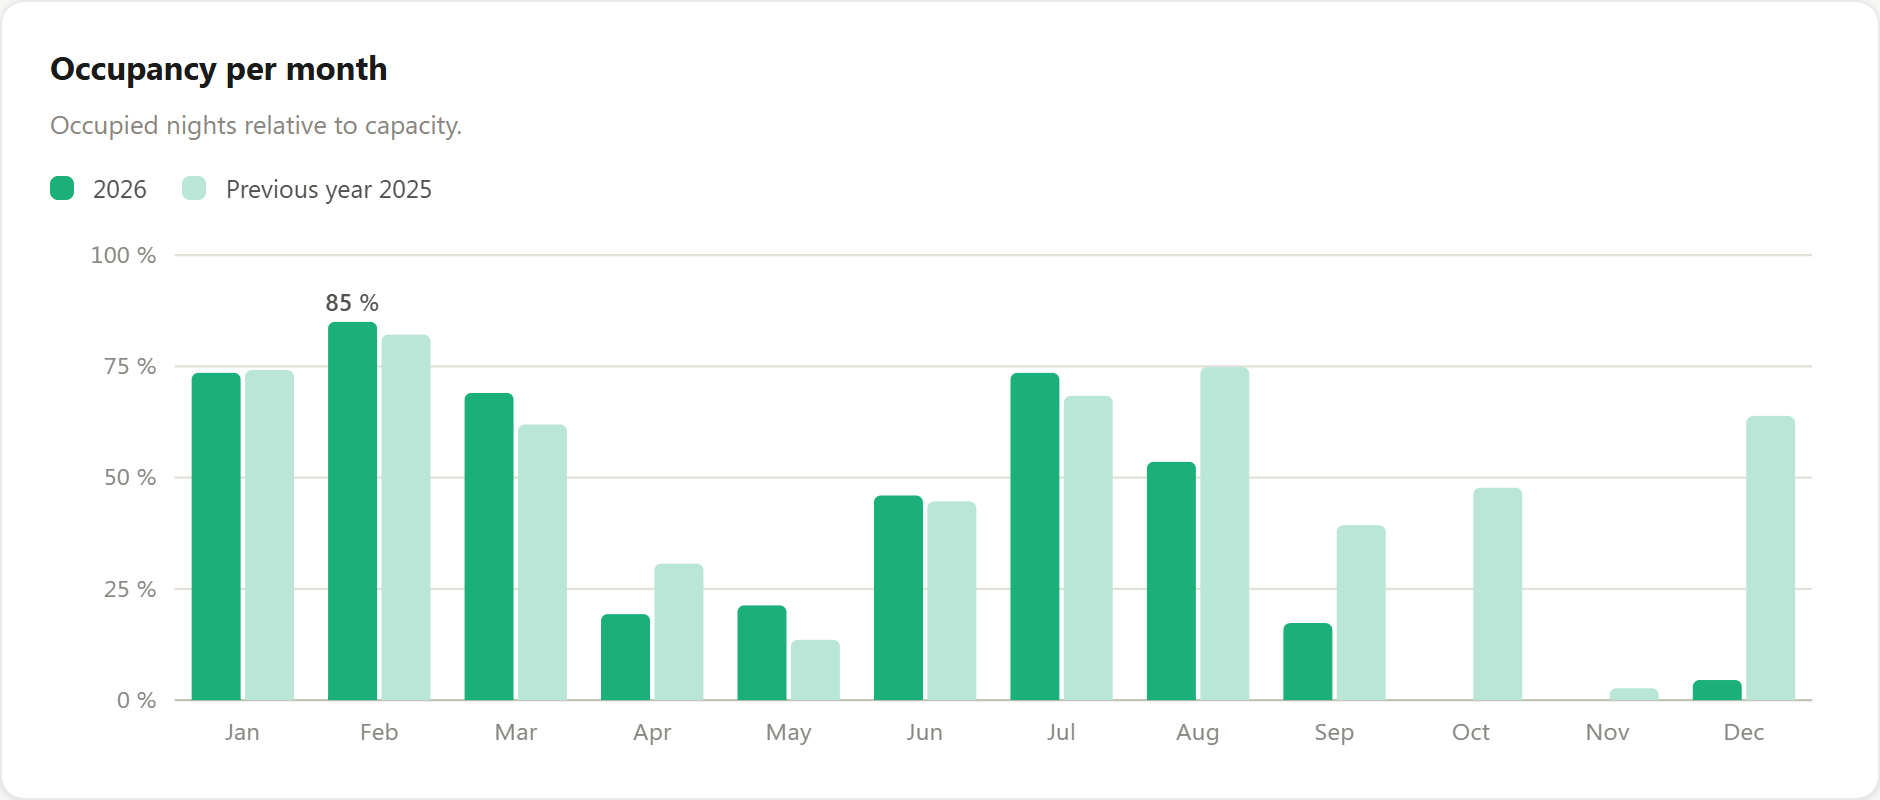
3. ADR — the average price per night sold
ADR (Average Daily Rate) is revenue divided by the nights actually sold. Not your list price, but what truly came in on average — after discounts, last-minute deals and weekend surcharges.
4. RevPAR — the master metric
RevPAR (Revenue per Available Night) is revenue per available night. Because it unites price and occupancy in a single number, it's the best yardstick for comparing properties, months or years fairly.
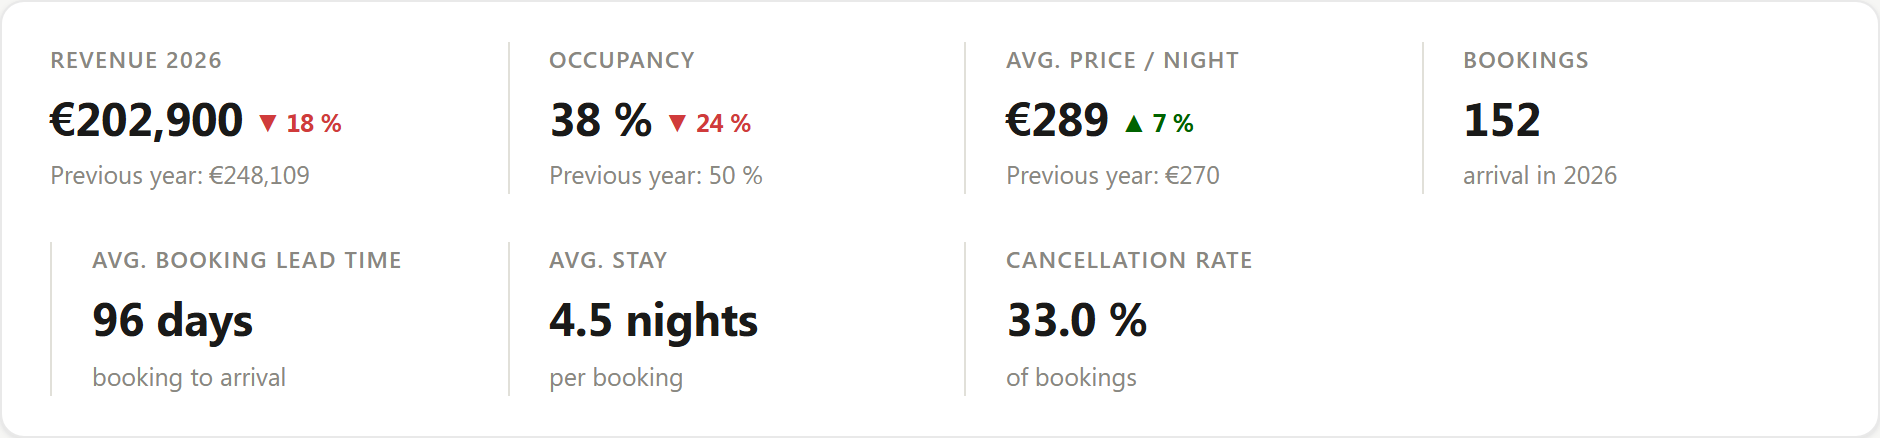
Work it out yourself: occupancy, ADR & RevPAR
Enter your own numbers — the calculator updates occupancy, ADR and RevPAR instantly. (Available nights = units × days; for one year with 5 units that's 5 × 365 = 1,825.)
Metrics calculator
Pre-filled with the example numbers above — just overwrite them.
The most common analysis mistake: the wrong base
Almost every misjudgement about your own performance comes from the same place — comparing numbers that aren't comparable:
- Gross instead of net: €1,000 via Booking.com is €850 after a 15 % commission. Compare channels gross and you draw the wrong conclusions.
- Blocked days in the denominator: Owner use lowers reported occupancy even though no revenue was "lost".
- A finished year against a half-finished one: Current-year revenue is almost always below the completed prior year — simply because months are still missing. The fair comparison is the cut-off date.
From metric to decision: pace & forecast
A single metric is a snapshot. The real question is: am I ahead of or behind last year — at the same cut-off date? The booking pace comparison (in hotels simply "pace") puts exactly that side by side: how much revenue for the coming August is on the books today, compared with the same day last year?
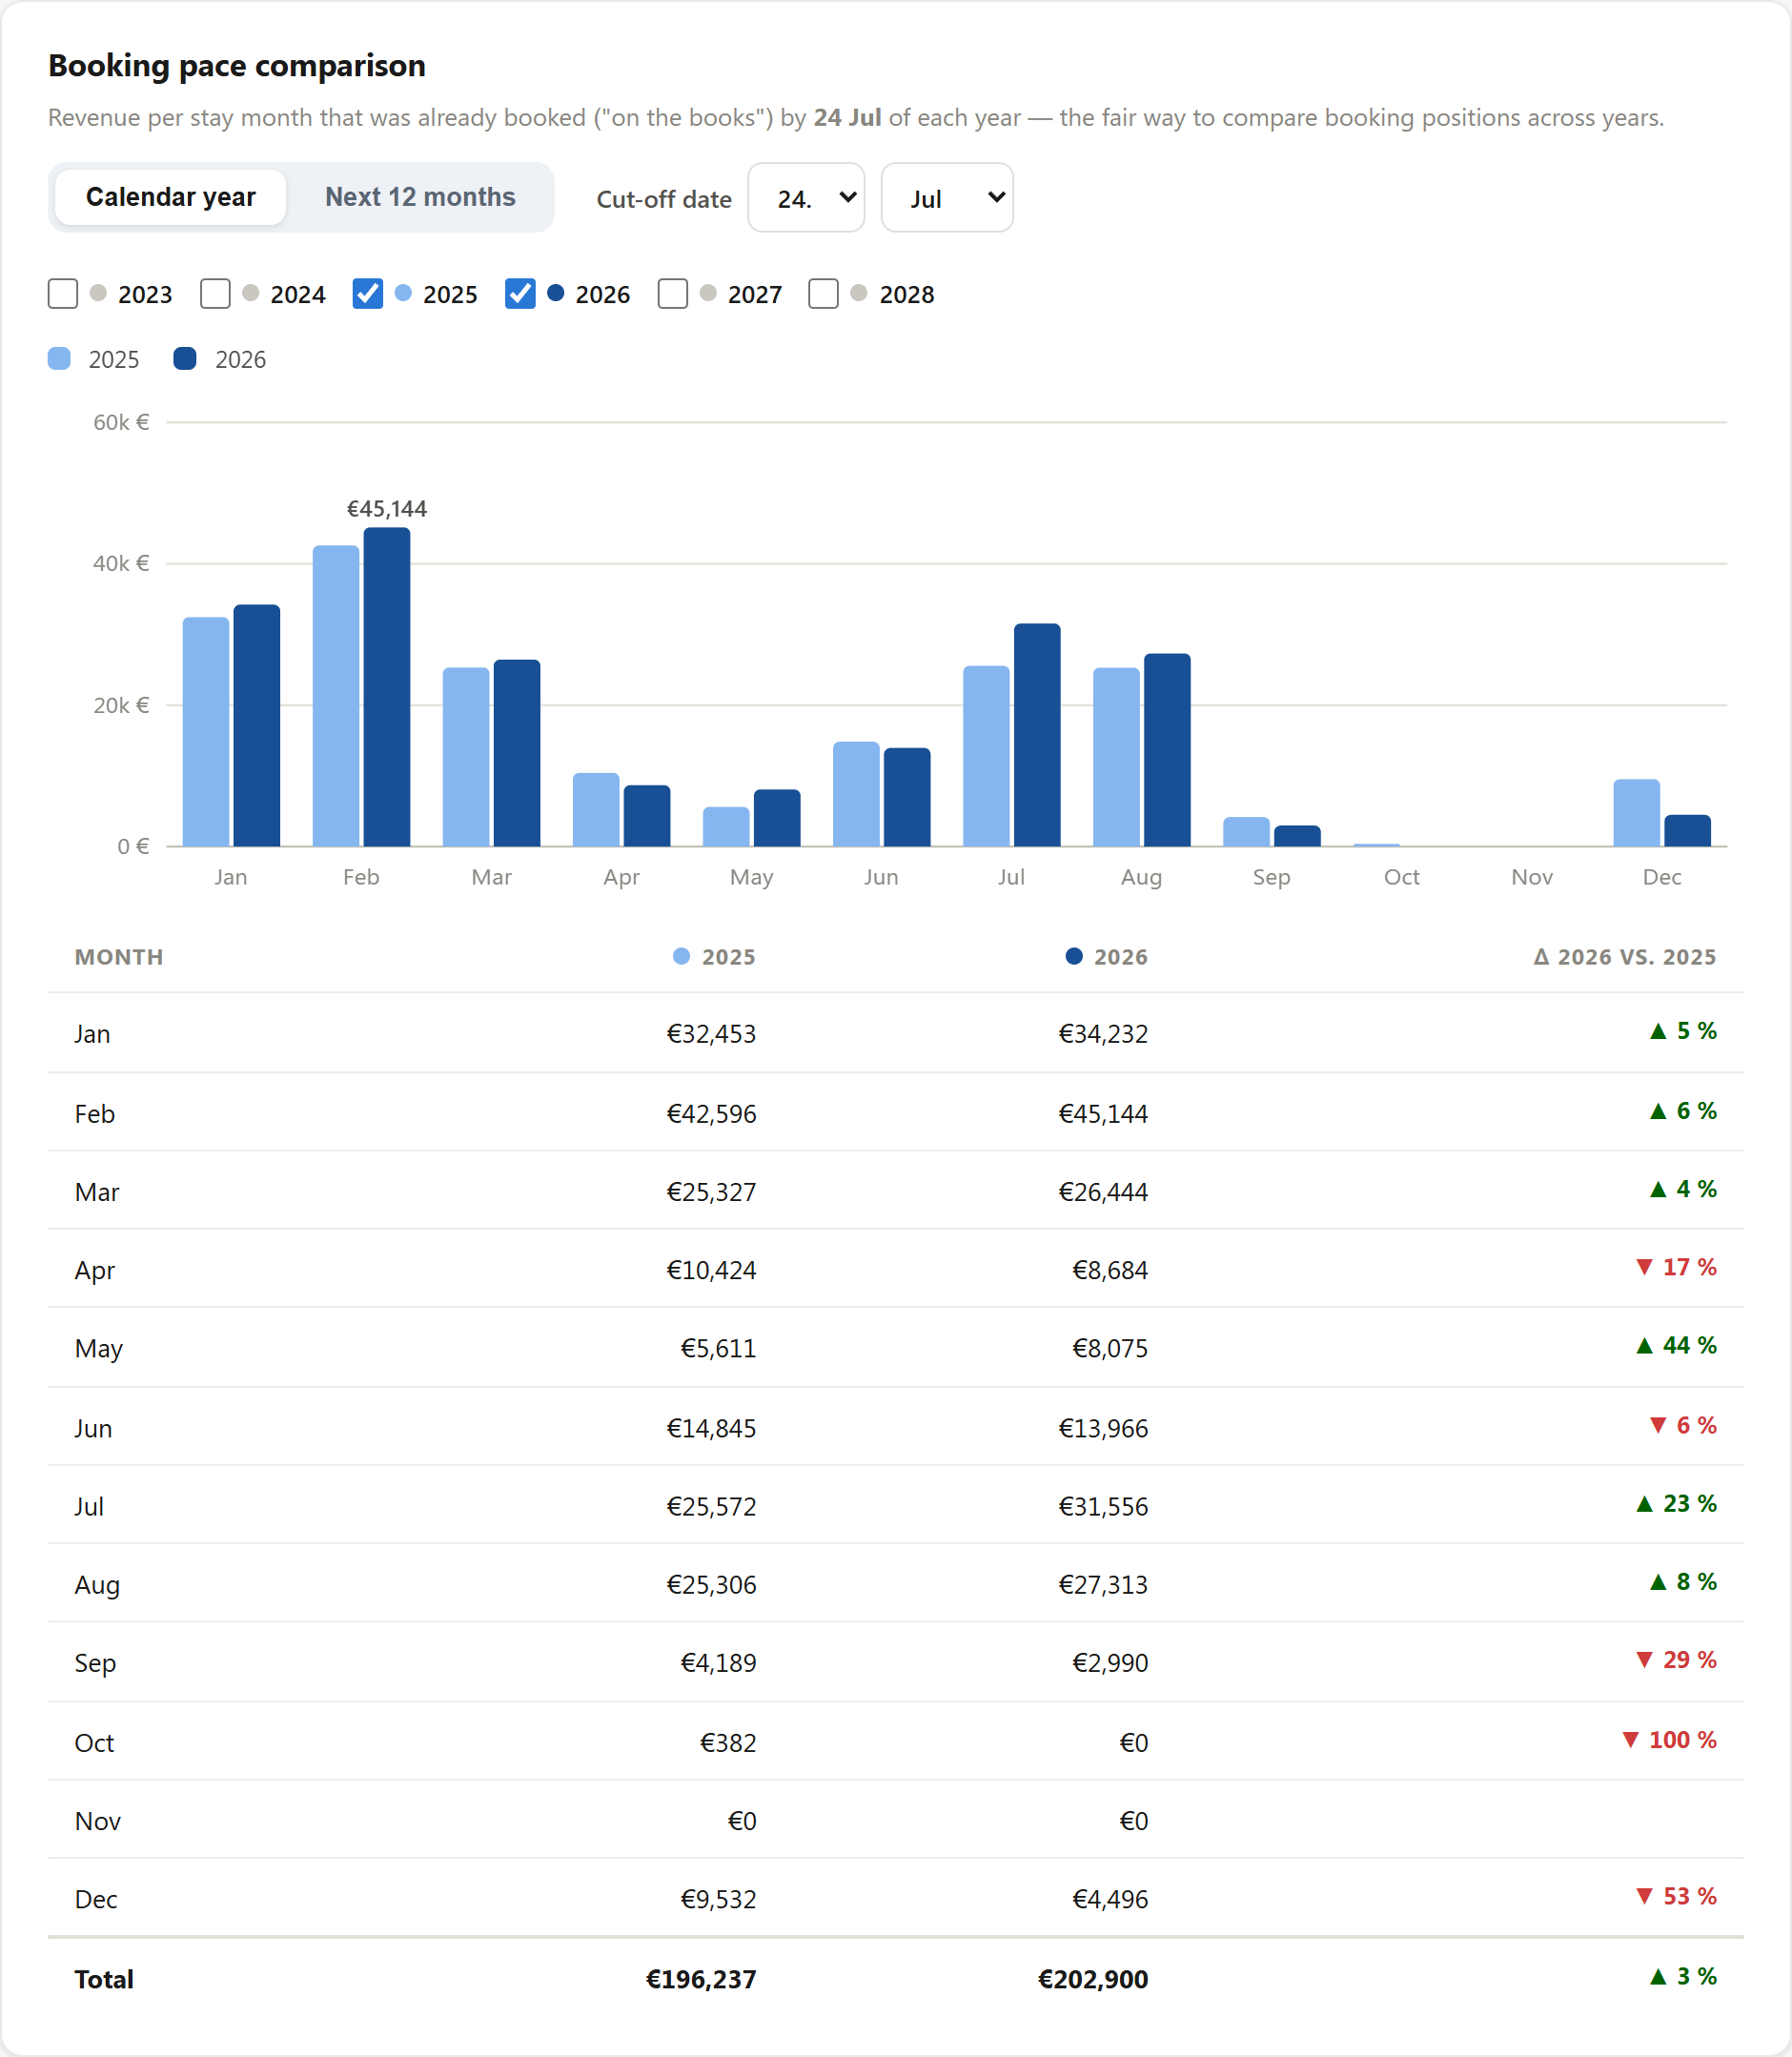
If a month is clearly weaker at the cut-off than last year, you still have time to react — with discounts, relaxed minimum stays or last-minute deals. More in the guide Booking pace report.
Compare channels net — not gross
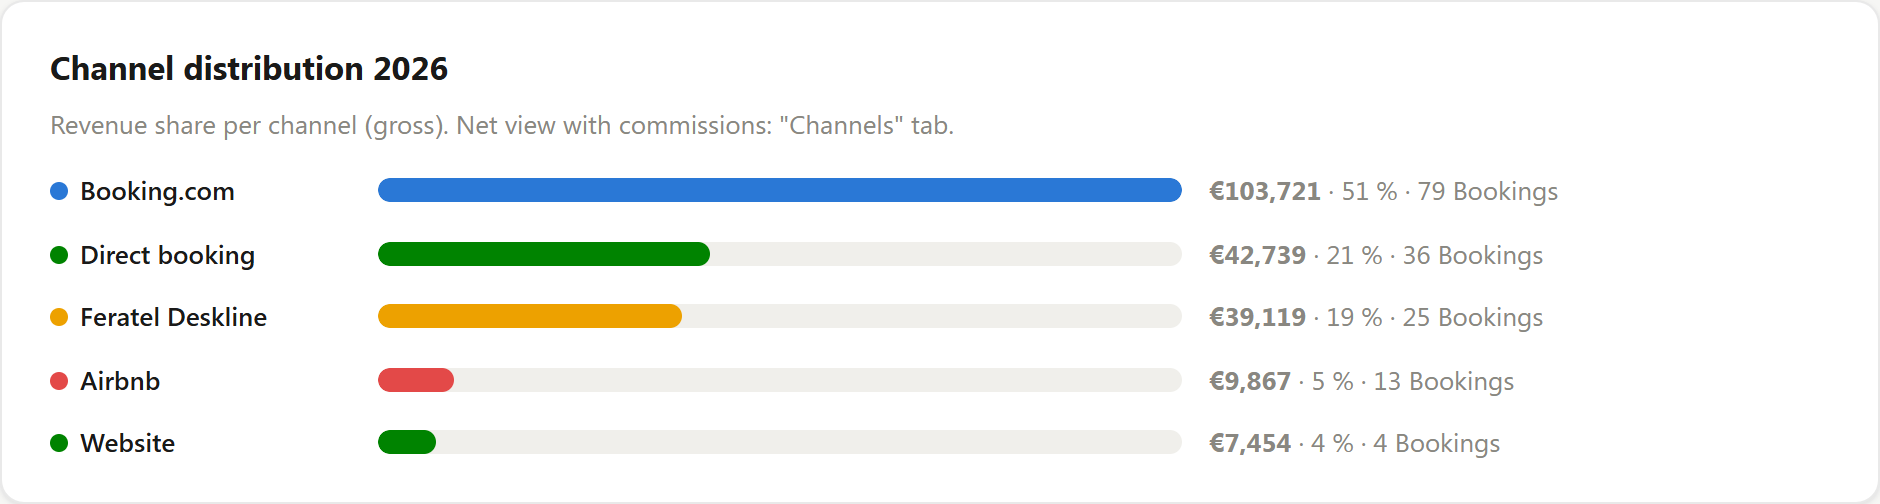
Every booking channel costs a different amount. Only once you subtract the commissions do you see what a channel really contributes — and whether a direct booking at a lower price ends up netting more than a pricier portal booking. How to line that up cleanly (and why "switch the channel off" is usually an expensive mistake) is in the guide Channel profitability.
How to evaluate your Smoobu numbers in 2 minutes
Everything above can be calculated by hand — but nobody does it every week. That's exactly what SmooInsight is for: it connects to your account via the official Smoobu API (read-only, set up in about two minutes) and calculates revenue, occupancy, ADR, RevPAR, the booking pace comparison, the forecast and channel profitability automatically — continuously updated, per property or for any combination of properties you like.
Your Smoobu credentials stay encrypted and nothing is changed — SmooInsight only reads. The number graveyard turns into a cockpit where you see where you stand at a glance.
Try it for free
Frequently asked questions
Does Smoobu show revenue statistics?
Yes, Smoobu shows revenue and bookings in the dashboard and offers a CSV export. For deeper analysis such as ADR, RevPAR, occupancy against capacity, the year-over-year booking pace comparison or a revenue forecast, the built-in reports usually fall short — that calls for a complementary analysis.
How do I calculate the occupancy of a vacation rental?
Occupancy = booked nights ÷ available nights × 100. Available nights are number of units × number of days in the period. Important: only genuine availability counts — deliberately blocked days (e.g. owner use) should be removed from the denominator, otherwise your occupancy looks worse than it is.
What is the difference between ADR and RevPAR?
ADR (Average Daily Rate) is the average price per night actually sold: revenue ÷ booked nights. RevPAR (Revenue per Available Night) is revenue per available night: revenue ÷ available nights. RevPAR combines price and occupancy in a single number and is therefore the most meaningful metric for comparing properties or years.
What is a good occupancy rate for a vacation rental?
It depends heavily on location and season and cannot be stated as a universal figure. More meaningful than an absolute target is comparing against yourself: the same property in the prior-year period and the booking level at the same cut-off date. That is exactly what a pace comparison is for.
Can I evaluate Smoobu statistics automatically?
Yes. SmooInsight connects to your account via the official Smoobu API and calculates revenue, occupancy, ADR, RevPAR, booking pace, forecast and channel profitability automatically and continuously updated — no CSV export and no spreadsheets.